Do you ever wonder how our real estate market is here in Des Moines? Unfortunately, we spend a lot of time listening to how rough things are in other cities around the country, but too often we don’t really consider what our real estate climate is like.
I’m a fan of having as much information available before I take action on any big decisions. I don’t know about you, but I think buying or selling a home is a pretty big deal.
As a blogger and mortgage professional, when I receive good information – I pass it on. Home listings and sales are an interesting set of information most of us don’t have super easy access to. Thankfully, I have a Realtor that hammers me with e-mails (Just kidding, I don’t mind them) on market updates and her opinion on where things are at.
Whether you’re looking to purchase, sell or refinance a home – this stuff matters. These statistics are compiled from the Multiple Listing Service and cover the Des Moines, Iowa residential real estate market.
With her permission, I post the facts here so you can come up with your very own market opinion. Here’s this week’s market commentary:
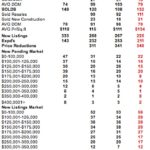
” It was a pretty quiet week which is to be expected during a holiday. We did close out June with 734 sales which is down about 38% from June of 2007. Our days on market for June was only 85 days which is an improvement. More good news is that prices are holding steady. If you are thinking about putting your house on the market right now I would advise to price it aggressively and have it ready to show at all times. Buyers are picky right now, but they are still buying.” – Heather Barglof, Peoples Real Estate Company

(Click to Hugisize)
I really enjoy this chart because it gives a breakdown of:
- Days on the Market
- Price Per Square Foot
- Number of New Listings
- Number of Expired Listings
- Number of Price Reductions
- Pending Home Sales (by price)
- New Home Sales (by price)
- All Active Home Sales (by price)
- Best of all, it compares this week vs. last week and last year!
This is a great chart. I’m not a Realtor and would never try to take the place of one. If you’re looking for statistics in your specific neighborhood (because your neighborhood is the only one that matters when you’re selling), I can help connect you with the right Realtor for the job!
If you’re a super cool person and have any market statistics you think our readers would find valuable, please feel free to contact me. If it’s relevant, It’ll show up here!
If you’re looking for my professional opinion or looking for a comment (press related), please contact me here.
Related Posts
 Des Moines Iowa Real Estate Market Watch – Week of September 22nd, 2008
 Des Moines, Iowa – Real Estate Market Watch – Week of July 14th, 2008
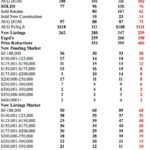 Des Moines Iowa Real Estate Market Watch – Week of October 20th, 2008
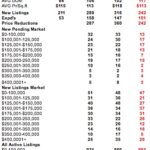 Des Moines, Iowa – Real Estate Market Watch – Week of May 19th, 2008
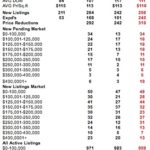 Des Moines, Iowa – Real Estate Market Watch – Week of May 26th, 2008
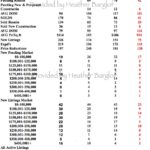 Des Moines Iowa Real Estate Market Watch – Week of December 22nd, 2008