
What’s The Real Estate Market Doing?
Do you ever wonder how our real estate market is here in Des Moines? Unfortunately, we spend a lot of time listening to how rough things are in other cities around the country, but too often we don’t really consider what our real estate climate is like.
I’m a fan of having as much information available before I take action on any big decisions. I don’t know about you, but I think buying or selling a home is a pretty big deal.
As a blogger and mortgage professional, when I receive good information – I pass it on. Home listings and sales are an interesting set of information most of us don’t have super easy access to.
Do YOU Need Help?
As a mortgage professional, I cannot sell real estate. I can however help you connect with a Realtor. If you are looking for some answers, I’d be happy to introduce you to someone who can help! No question is silly or too off the wall.
I can also reach out to my connections throughout the country if you’re looking for real estate outside of Iowa. So please, feel free to contact us, we’d love to help!
Why Should You Care About Statistics?
Whether you’re looking to purchase, sell or refinance a home – this stuff matters. These statistics are compiled from the Multiple Listing Service and cover the Des Moines, Iowa residential real estate market.
With his permission, I post the facts here so you can come up with your very own market opinion. Here’s this month’s market commentary compliments of Mr. Les Sulgrove of Iowa Real Estate Solutions:
“As anticipated, December Pendings continued the free fall that began last October. This month showed a daily average of 910 pending transactions. Expectations are that January business will pick back up as long as weather doesn’t become a factor and that 2010 will start out stronger than the way 2009 did.
2009 Monthly Average Pending Transactions

2009 Pending Sales Chart

The year 2009 ended with 850 Pending residential transactions on the books. Compare that to January 1st, 2009 when we started off with 675. As we move into 2010, I will be showing Pendings as they overlay on the 2009 chart. This way we will have a good idea how we compared to last year as well as have a strong visual of the trend of business throughout the year. Don’t forget, I produce a mid-month report on the 15th that focuses on Sold transactions.
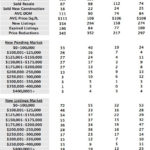
December Home Inventory Stats By Price Range

December can be a tricky month to predict. Depending on weather, it can be boom or bust. I’m encouraged by the amount of activity that we saw this month considering that we received over 2 feet of snow from two major snowstorms. The number of listings on the market declined in December ending the year barely above the 5,000 mark.
What Areas Were Hot in December


Ankeny led the way in December with 23.3% of its residential listing inventory (85 homes) going pending. Runners up communities were the southwest part of Des Moines at 22.2% of inventory pended followed by Johnston at 21.8%.
In the condo/townhome front, Indianola led the area selling 5 of 14 listings (35.7%) followed by a tie for second from Norwalk and Des Moines Northwest selling 27.3% of its inventory in December. The city of West Des Moines led with highest actual number of pending sales at 27 for December with a pool of 195 to choose from.”
Related Posts
 The Tax Credit has Expired but Rates are Low and It’s Still a Great Time to Buy
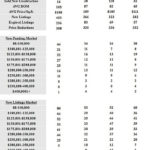 Des Moines Sales Are Down. Big Time.
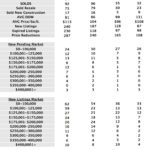 Take Advantage Des Moines, Put Your House on the Market Early
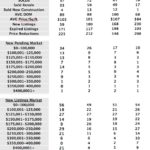 Listings in Des Moines Should Increase with the Temperature
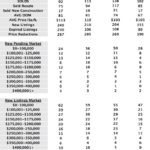 Real Estate Predictions for Des Moines in 2010
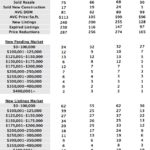 Home Sales in Des Moines Have Surpassed 2008’s Numbers