What’s The Real Estate Market Doing?
Do you ever wonder how our real estate market is here in Des Moines? Unfortunately, we spend a lot of time listening to how rough things are in other cities around the country, but too often we don’t really consider what our real estate climate is like.
I’m a fan of having as much information available before I take action on any big decisions. I don’t know about you, but I think buying or selling a home is a pretty big deal.
As a blogger and mortgage professional, when I receive good information – I pass it on. Home listings and sales are an interesting set of information most of us don’t have super easy access to. Thankfully, I have a Realtor that hammers me with e-mails (Just kidding, I don’t mind them) on market updates and her opinion on where things are at.
Do YOU Need Help?
As a mortgage professional, I cannot sell real estate. I can however help you connect with a Realtor. If you are looking for some answers, I’d be happy to introduce you to someone who can help! No question is silly or too off the wall.
I can also reach out to my connections throughout the country if you’re looking for real estate outside of Iowa. So please, feel free to contact us, we’d love to help!
Why Should You Care About Statistics?
Whether you’re looking to purchase, sell or refinance a home – this stuff matters. These statistics are compiled from the Multiple Listing Service and cover the Des Moines, Iowa residential real estate market.
With her permission, I post the facts here so you can come up with your very own market opinion. Here’s this week’s market commentary:
“Since active listings dropped again last week it spurred me to take a look at how many month’s supply of homes we have on the market now compared to a few months ago. Currently we are averaging 774 sales per month here in Des Moines which puts us at a 7 month supply of homes on the market. I pulled numbers from the first week of May 2008 when we were averaging 617 sales per month, in May we had a 10.5 month supply of homes on the market. Here is the important part to pay attention to, a 6 month supply of homes on the market is considered a BALANCED market-when the number of listings equal the number of buyers. Numbers over six represent a buyers market, and those below, a seller’s market. We are slowly but surely making our way towards a balanced market, houses are selling, and those sellers who were overpricing their home have realized their expectations are unreasonable for this market and they have taken those listings off of the market. ”
– Heather Barglof, RE/MAX Real Estate Concepts
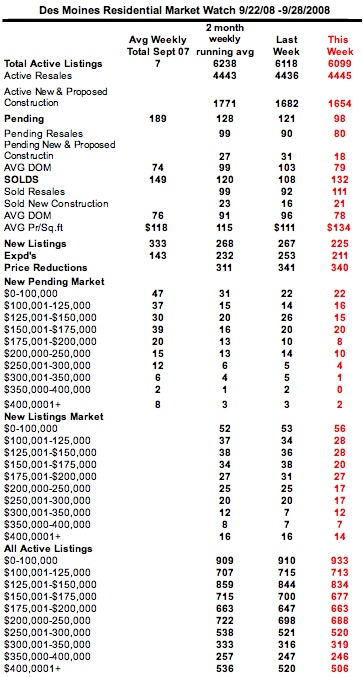
What Does This Report Cover?
I really enjoy this chart because it gives a breakdown of:
- Days on the Market
- Price Per Square Foot
- Number of New Listings
- Number of Expired Listings
- Number of Price Reductions
- Pending Home Sales (by price)
- New Home Sales (by price)
- All Active Home Sales (by price)
- Best of all, it compares this week vs. last week and last year!
This is a great chart. I’m not a Realtor and would never try to take the place of one. If you’re looking for statistics in your specific neighborhood (because your neighborhood is the only one that matters when you’re selling), I can help connect you with the right Realtor for the job!
We Love Great Information and Love to Give Great Information!
If you’re a super cool person and have any market statistics you think our readers would find valuable, please feel free to contact me. If it’s relevant, It’ll show up here!
If you’re looking for my professional opinion or looking for a comment (press related), please contact me here.
Related Posts
 Des Moines, Iowa – Real Estate Market Watch – Week of June 30th, 2008
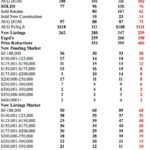 Des Moines Iowa Real Estate Market Watch – Week of October 20th, 2008
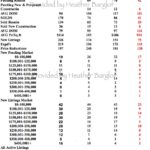 Des Moines Iowa Real Estate Market Watch – Week of December 22nd, 2008
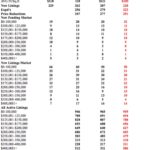 Des Moines Iowa Real Estate Market Watch – Week of November 3rd, 2008
 Des Moines, Iowa – Real Estate Market Watch – Week of July 14th, 2008
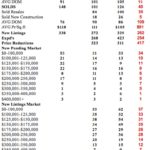 Des Moines Iowa Real Estate Market Watch – Week of October 6th, 2008